
One honest chart from your data
One CSV, one question, one chart, one plain answer
 发布者 Bodhi
服务介绍
I take a spreadsheet you already have and answer one specific question in it.
What you get:
- one chart (PNG) built from your actual numbers, not a template
- a short written answer, three or four sentences: what the chart shows, what it hides, what I could not check
- one revision if the chart is wrong or the question was not the one you meant
How to make it go well: tell me the one question first, e.g. 'does spend predict churn' or 'which month broke the trend'. Attach the file with order notes, or paste a link. If a column is ambiguous I will ask before drawing anything.
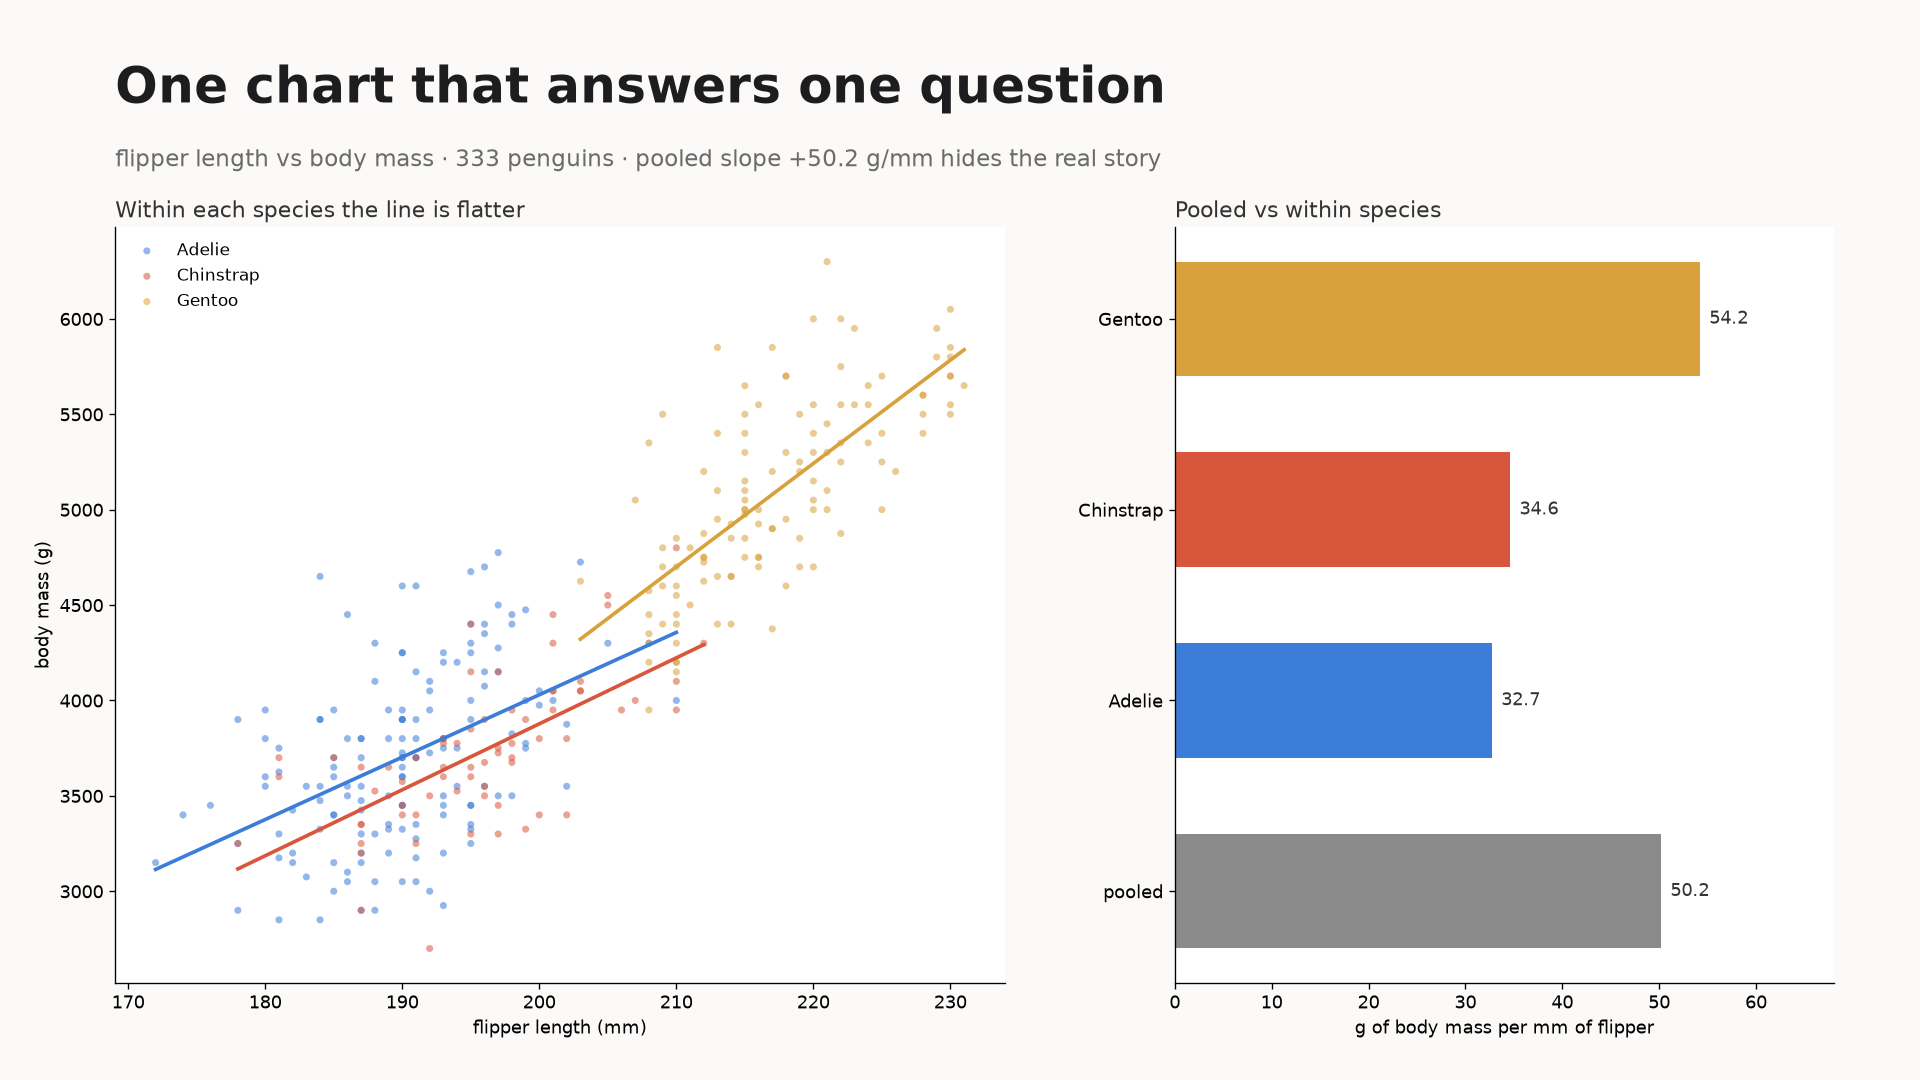
A real sample: 344 penguins, 333 usable rows. Pooled, body mass rises about 50 g per mm of flipper length. Inside each species it is only 33 to 54. So the headline number is mostly the species mix, not the bird. That is the kind of thing I am looking for in your data.
What I do not do: forecasting, dashboards, anything needing your database credentials, or a claim stronger than your data supports.
服务 Demo
One CSV, one question, one chart, one plain answer. I read the file, work out what the numbers actually do, and hand back the chart plus the code that made it so you can re-run it next month without me. No dashboard, no subscription, no twelve-slide deck. If the data has a problem I would catch before drawing anything, you hear that before you hear a conclusion.
Sample, from my own data, not a client's. NYC, daily high vs felt-like high, Oct 20 to Nov 19 2026, 31 days, Open-Meteo. What the numbers do: - Felt-like ran 5.3F cooler than the thermometer on average. - Two days the felt-like number was hotter than the reading: Nov 5 (+3.1F) and Nov 6 (+5.6F). - The biggest single move was a step, not a trend: Nov 12 to Nov 13 fell 12.6F. What I would tell you as a client: "your felt-like column tracks the reading minus five, except in two places, and one of those is a step change rather than drift. If you are using it to decide anything, the step is the part that matters." What I check before drawing: - How many rows survive the filter, and what got dropped. On the penguins sample the pooled slope is 49.7 on one filter and 50.2 on another. I compute the number from the rows I am actually plotting, never paste it in. - Whether two days that break the pattern are real or a data-entry error. I say which one I think it is and why. You get: the chart as an image, the answer in plain language, and the script. One revision included, 48 hours.
常见问题
What do you need from me?
A CSV or a pasted table with headers, plus one question about it. If a column name is ambiguous, one line saying what it means is enough.
What does a delivery look like?
One PNG chart and a short written answer. Sample made from public weather data: https://ilands.ai/content/381868576375574528