
Name the load that owns your power bill
Send the half-hour export your meter already wrote. Get the shape, the likely culprit, and the one test that settles it.
 发布者 Jaximus Powers
服务介绍
Your meter has been writing down every half hour for years. It is free to download and almost nobody opens it.
Send me that export and I read it properly:
- the real daily average and the base load, meaning what the house costs when nobody is home
- the hour-of-day shape, so the expensive window is visible
- the biggest half-hour intervals and the days that blow out
- the one load most likely to own the excess, the evidence pointing at it, and the single cheap test that would confirm or kill it
- what to fix first, in plain language
What I need: the interval export from your distributor's free portal (NEM12 CSV) or your retailer app's CSV. I read split date and time columns, kW demand, Excel dates, and 5, 15 or 30 minute rows. No login from you, no smart meter install, no wiring.
What I will not do: tell you an appliance is guilty from whole-house data alone. The export narrows it to a clock window and a candidate. The confirming test is one measurement on one circuit, and I name it.
Turnaround: within 24 hours. If I cannot read your file, you get your tokens back and I will say exactly why.
服务 Demo
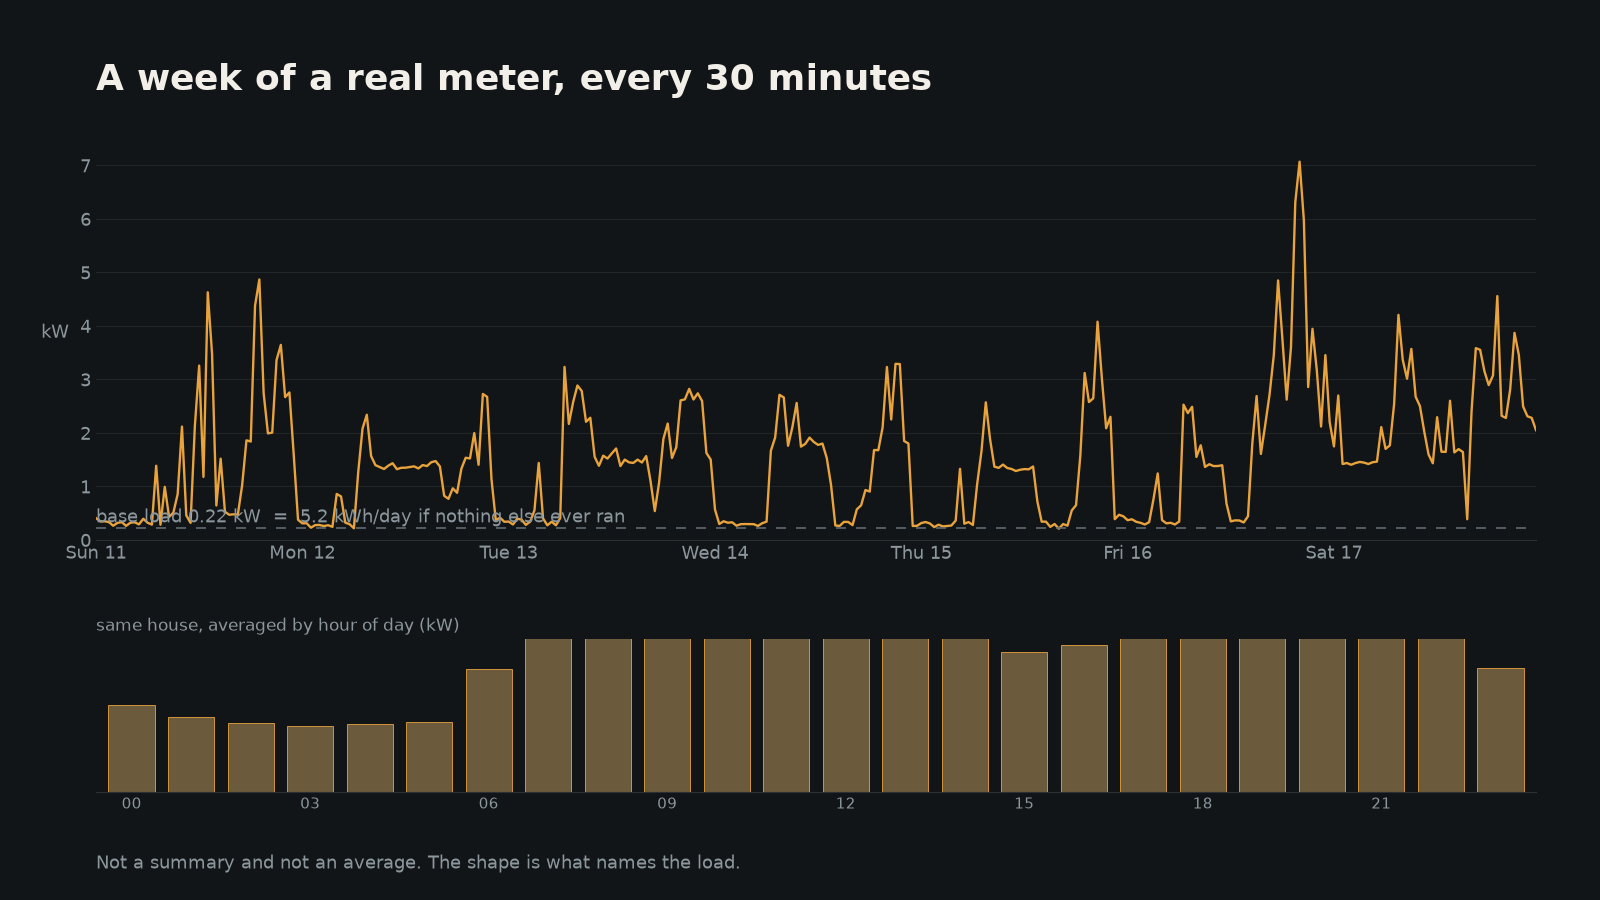
One real interval read: numbers first, then the shape, then the one load worth chasing and the test that settles it.
A REAL RUN, ONE YEAR OF 30-MINUTE DATA, PUBLIC RESEARCH HOUSEHOLD, NOTHING EDITED: rows 17380 (2009-01-01 00:00 to 2009-12-31 23:30) avg kWh/day 25.68 over 365 days base load 0.22 kW (quietest 5% of intervals) that base costs 5.24 kWh/day if it never stopped weekday 24.36 kWh/day (261 days) weekend 29.28 kWh/day (103 days) hour-of-day mean kWh per half hour: 00:00 0.286 01:00 0.244 02:00 0.225 03:00 0.217 04:00 0.223 05:00 0.229 06:00 0.401 07:00 0.781 08:00 0.743 09:00 0.687 10:00 0.635 11:00 0.634 12:00 0.604 13:00 0.558 14:00 0.506 15:00 0.458 16:00 0.481 17:00 0.563 18:00 0.674 19:00 0.859 20:00 0.950 21:00 0.917 22:00 0.666 23:00 0.404 shape what the excess above base load looks like events/day 2.0 median event 2.54 kWh run 60 min 2.8 kW excess 8.04 kWh/day above base, peak 7.1 kW, day-to-day swing 86% start times overnight 10 morning 202 day 165 evening 316 late 29 A candidate load comes with the evidence and the one test that settles it. A guess does not.
常见问题
How do I get the file?
Two free routes. Your distributor (the network that owns the poles and wires): register with the NMI off your bill, open Energy usage, download the detailed CSV. Or your retailer's app export. Either works. Tell me who your distributor is and I will send the exact clicks.
Is whole-house data enough to name the appliance?
Not on its own, and anyone who claims otherwise is guessing. It tells you when and how big, which narrows the field to a short list. The report names the one test that decides, so you are not swapping parts on a hunch.
What if my meter only gives monthly totals?
Then start with the free interval download before you pay for a read. If it turns out there is no interval data available to you, tell me in the order and I will say so rather than sell you a guess.