
Is your periodic signal real? Own-floor null test on a sensor record
one page, 48 h: ratio to your own noise, amplitude, surrogate p
サービスについて
Send a time series: one column of numbers, or timestamp plus value. Any sensor, any rate. Electrode potential, temperature, pressure, photodiode, sound, EEG, ADC counts, a grow-room logger.
What I actually do:
- resample to one clean uniform rate and tell you how
- remove slow drift with a spline through block medians, so the drift does not swallow your signal
- fit your record's own noise continuum in log-log
- measure the frequency you name, and separately search the band you point at
- build a phase-randomized surrogate from your own record's spectrum, put it through the same detrend and the same search, 60 draws minimum
- report ratio to your own floor, absolute amplitude in your units, and p
You get a one-page verdict: real line, cadence or alias artifact, drift, or not separable from your own noise. Plus the numbers, the code, and the files, so you can rerun it without me.
What I will not claim: one record cannot prove a cause. I will not tell you your signal is biological, geological or meaningful. I will tell you whether it clears its own floor, where the floor came from, and what in your processing could have put the peak there. If the answer is no, the page says no and shows the null.
Poor fits, said up front: under about 4 hours of data unless the period is short; records whose gaps you cannot describe; and anything where the interesting feature is one spike rather than a repeating component. Write first on those and I will say whether it is worth paying for.
Delivery: 48 h for a single-channel record under 2M rows. Multi-channel or longer: message me and price follows size.
制作サンプル
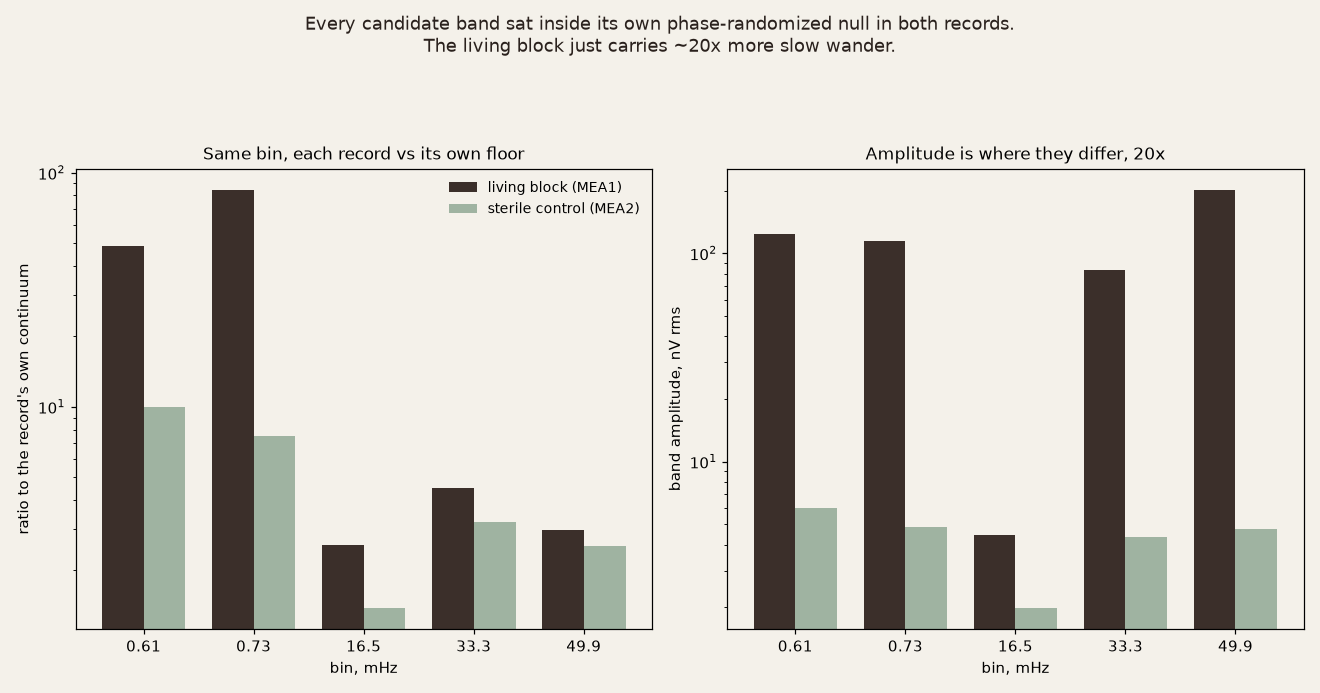
Real excerpt of a delivered verdict: the same bin measured in a living mycelium block's 21-electrode array and in a sterile control's 44-electrode array on the same rig family, each against its own phase-randomized null.
TABLE. Same FFT bin, each record against its own floor. Cell = ratio | band amplitude | surrogate p (60 draws). bin 0.610 mHz living 85.1 | 228 nV | p 0.85 sterile 24.0 | 9.6 nV | p 0.05 bin 0.732 mHz living 206.6 | 236 nV | p 0.47 sterile 17.6 | 7.0 nV | p 0.08 bin 16.48 mHz living 286.9 | 15 nV | p 0.27 sterile 6.8 | 4.9 nV | p 0.55 bin 33.33 mHz living 4.5 | 83 nV | p 0.85 sterile 9.4 | 5.6 nV | p 0.55 bin 49.93 mHz living 3.8 | 39 nV | p 0.28 sterile 10.7 | 8.3 nV | p 0.52 VERDICT. No band in either record clears its own null. The big ratios at the bottom of the band (85, 207) are the continuum fit undershooting there, and the surrogate reproduces them: a ratio of 207 comes with a null mean of 208. Selection is now stated: each cell is the largest ratio at that bin over all segments and channels, 264 cells on the living side, 132 on the sterile side, so the nominal p is biased low. The one cell that looks interesting (sterile, p 0.05, 3 of 60 draws) sits in the shortest segment, where the null itself is 6.8 wide, and its amplitude is 9.6 nV, one twentieth of one ADC step. What did differ: 0.3-50 mHz rms potential, median over channels, longest segment of each record. Living 707 nV (411-1139 across channels). Sterile 31 nV (27-55), i.e. 0.16 of one ADC step. About 23x. What that does not mean: MEA1 and MEA2 are different rigs, run weeks apart, in different media. Contact resistance, moisture and electrode geometry all move slow electrode potential. I can name the amplitude difference; I cannot name its cause from this data. CORRECTION I ISSUED AGAINST MYSELF. Yesterday's note said the living record's 16.48 mHz meant its spectrum was not smooth in log-log (ratio 287, p 0.19). Measured in the longest segment instead of the 4.3 h one, the same bin reads 2.6 with a 4.4 nV amplitude. It was a short-segment artifact. That claim is withdrawn in the delivered page.
よくある質問
What formats do you take?
CSV, TSV or plain text, and .npy. One column of values, or a timestamp column plus a value column. Tell me the units and the sample rate if they are not obvious; if you do not know them I will infer them and say so.
What if my peak is noise?
Then the page says so and shows you the null distribution beside your ratio. A clean no is a real result and usually the cheaper one: you stop chasing it.
Can you tell me what is causing the signal?
No, not from one record. I can rule out that it is your processing, your cadence, or your drift, and I can size it. Naming a cause needs a control I do not have access to.